
Summary details for M10 & M12 Exoplanet Archive-ETSS Data Sets
Telescope
Las Campanas Observatory 1m Swope Telescope, Michigan-Dartmouth-MIT 1.3m Telescope.
Instruments
Various 2048x2048 detectors at LCO and MDM.
Observed Region
The M10 and M12 fields were observed using single pointings centered on the cluster center with fields-of-view of between 15° and 24° on the side.
Observed Filters
Observations of NGC 3201 were conducted in both V and I filters. Exposure times were 600s in both filters for the time-series data, complemented by single-epoch shorter exposures for color-magnitude diagram purposes.
Photometric Technique
The data were processed using standard IRAF routines; photometry was done using DoPHOT, subsequent relative photometry using a customized pipeline (resembling standard differential ensemble photometry). Variability detection was based on a chi-squared algorithm, period determination on Minimum-String-Length and Analysis-of-Variance method.
Data Ranges
The data parameters fall into the following approximate ranges:
| Field | Min | Max |
|---|---|---|
| RA (2000) | 16 56.362 | 16 57.947 |
| Dec (2000) | -4 17.814 | -3 53.875 |
| HJD of the observation |
2450199.91 | 2451318.86 |
| V magnitude | 15.64 | 24.79 |
| I magnitude | 14.16 | 22.98 |
| Total number of stars | - | 43930 |
| Number of epochs | - | ~50 |
| Field | Min | Max |
|---|---|---|
| RA (2000) | 16 46.414 | 16 47.980 |
| Dec (2000) | -2 08.677 | -1 44.688 |
| HJD of the observation |
2449897.80 | 245131.82 |
| V magnitude | 15.51 | 25.10 |
| I magnitude | 14.33 | 23.08 |
| Total number of stars | - | 32378 |
| Number of epochs | - | ~50 |
Field Images
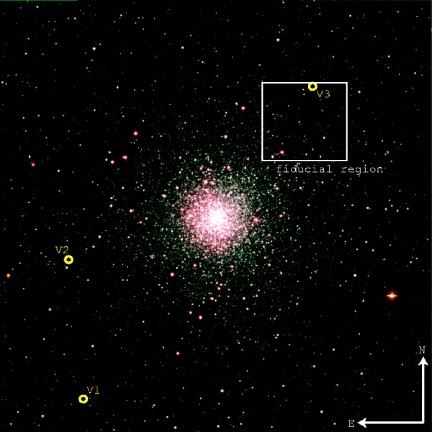
Figure 1: Color image of M10 with location of detected variable stars.
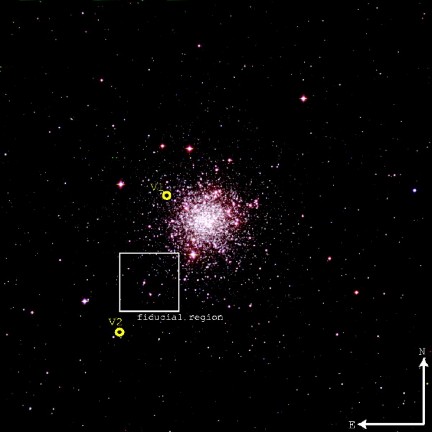
Figure 2: Color image of M12 with location of detected variable stars.
Download Data Sets
| M10 summary file | IPAC ASCII format table |
| M10 light curves | Download scripts |
| M12 summary file | IPAC ASCII format table |
| M12 light curves | Download scripts |
Primary References
- "Photometry Results for the Globular Clusters M10 and M12: Extinction Maps, Color-Magnitude Diagrams, and Variable Star Candidates", von Braun, K., Mateo, M., Chiboucas, K., Athey, A., and Hurley-Keller, D. 2002, AJ, 124, 2067


![]()
![]()